FWIW #40 - Graphs Don't Lie
Posted by Eugene Kelly(E. Aly) on Jan 2nd 2024
FWIW #40
The end of an interesting year has passed. Just when I thought we were in an Alice in Wonderland scenario, events showed me the worst craziness was still to come. I’m not going to go through the litany of geopolitical issues around the world. No one knows how those events will play out. When humans reach a point at which they feel they either have an upper hand over others or want to secure their power base in their locale, they commit crimes (war itself is a crime) and try to use the resultant blowback to prove their power and solidify their power base. The likelihood of a miscalculation on the part of many participants in this geopolitical turmoil continues to climb every day. That is a reason for maintaining liquidity in your portfolio.
The real issue affecting you and your financial health continues to be the Federal Reserve and the Biden administration’s Treasury Department. I’ve been critical of the Fed and continue to be so. It’s important, however, to understand that while I point out what I believe are debtor-biased policies of the Fed, those biased actions are part of what a portfolio’s composition should be based on. Fed and Treasury actions are reality. You can’t build your portfolio based on what monetary and fiscal policy should be but what monetary and fiscal policy is. So, let’s look at reality and what it means for your portfolio. We want to start with two definitions of inflation:
1.Too much money chasing too few goods.
2.With fiat currency, the monetary authorities deliberately issue too much currency with the intent of devaluing the currency in the present and future.
The Fed and Washington blame the inflation we have experienced and continue to experience on the pandemic, supply chain disruptions, and any number of issues they can conjure up to make you think inflation is not their fault. Look at this chart—it tells the truth.
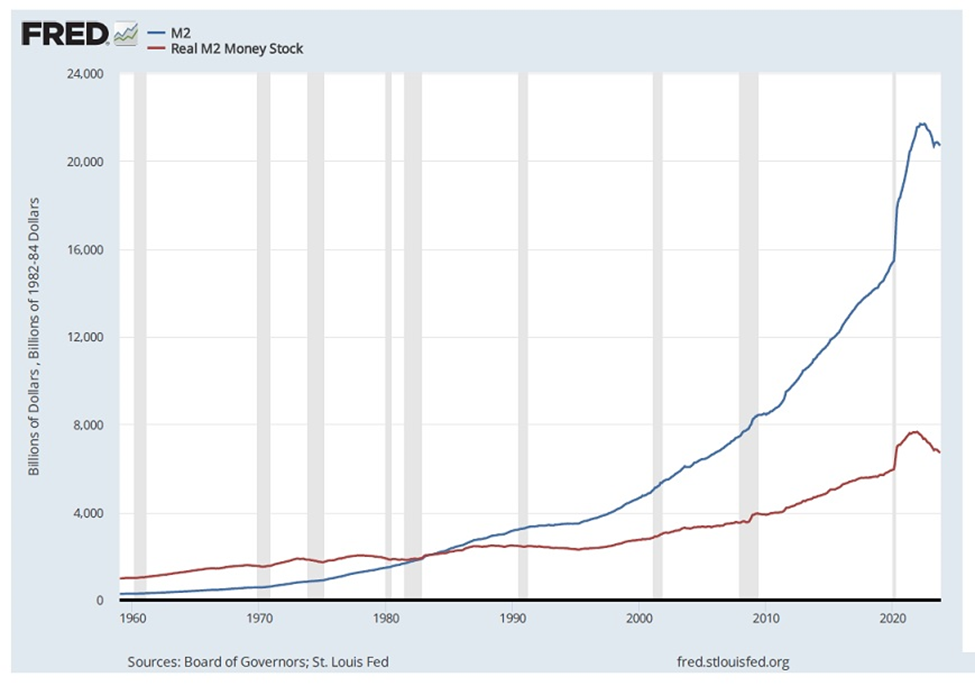
M2 (M2SL) and Real M2 Money Stock (M2REAL)
Units: M2SL—billions of dollars, seasonally adjusted; M2REAL—billions of 1982–84 dollars, seasonally adjusted
Frequency:Monthly
The M2REAL series deflates M2 money stock (https://fred.stlouisfed.org/series/M2SL) with CPI (https://fred.stlouisfed.org/series/CPIAUCSL).
Before May 2020, M2 consists of M1
plus (1) savings deposits (including money market deposit accounts); (2)
small-denomination time deposits (time deposits in amounts of less than
$100,000) less individual retirement account (IRA) and Keogh balances at depository
institutions; and (3) balances in retail money market funds (MMFs) less IRA and
Keogh balances at MMFs.
Beginning May 2020, M2 consists of M1 plus (1) small-denomination time deposits
(time deposits in amounts of less than $100,000) less IRA and Keogh balances at
depository institutions; and (2) balances in retail MMFs less IRA and Keogh
balances at MMFs. Seasonally adjusted M2 is constructed by summing savings
deposits (before May 2020), small-denomination time deposits, and retail MMFs,
each seasonally adjusted separately, and adding this result to seasonally
adjusted M1.
Source: Board of Governors of the Federal Reserve System (US), M2 [M2SL] and Real M2 Money Stock [M2REAL], retrieved from FRED, Federal Reserve Bank of St. Louis; https://fred.stlouisfed.org/series/M2SL, December 21, 2023.
In case you don’t have colored lines, the M2 money supply is the blue line that starts lower in the 1960s, then crosses over the red line, M2 deflated by the CPI, in 1983, and accelerates to the upper right by October 2023. The red line is on the graph to show the accelerating inflation, i.e., devaluation, of the currency every year since 1960. Further, each vertical shaded area of the graph denotes a recession. Notice there were more recessions from 1960 to 1990 (six) than there have been from 1990 to 2023 (three). Economists will tell you the fewer recessions are due to Fed monetary policy change and the continued deficit spending by the federal government enabled by the Fed policy shift. When Alan Greenspan’s Fed deliberately changed from Paul Volcker’s creditor-friendly, stable currency, monetary policy in the 1980s and early 1990s to a debtor-friendly monetary policy, fiscal and monetary discipline were abandoned. Since the Fed policy change, excessive irresponsibility on the part of debtor/speculators and their infection of individual speculators has been the trigger causing recessions. Each time, the Fed quickly responded to political pressure and modified any recession by pumping out more money and suppressing market-determined interest rates to help the debtor/speculators and their political associates.
It’s important you understand by looking at the chart that the devaluation of the dollar began in earnest during Ronald Reagan’s administration and accelerated through every Republican and Democratic administration since. Only when the cumulative irresponsibility of the Fed FOMC and Washington’s political establishments finally exploded in politically damaging inflation did the current Fed and administration halt the money supply growth. Notice the 2022 decline and subsequent flattening of the money supply. These changes are the reason the rate of inflation has slowed in the past few months.
As an aside, notice in the chart explanations that the CPI is used. The Fed ignores CPI in setting policy that favors the PCE index, which arbitrarily assumes consumers shift from pricier goods to cheaper ones when inflation heats up. What does that say about the non-political base of the Fed?
With the halting of the explosive M2 growth, Fed officials, Wall Street analysts, and hedge fund managers are all claiming victory over inflation. Unless the M2 continues to decline or move sideways (allowing the velocity of M2 to increase to support the economy), the inflation rate will begin to increase again. The most important factor in thinking about future inflation is watching the growth of M2 from here. There is another aspect to Fed policy that enters the picture and is related to M2.
The Fed balance sheet ballooned from less than $1 trillion in 2008 to over $8.8 trillion in 2022. The Fed announced in 2022 that it would shrink its balance sheet on a steady basis (approximately $95 billion a month) at the same time it was raising interest rates. This two-pronged approach to tightening monetary policy was needed to get inflation under control. Interest rates rose to a point at which short-term rates were “normal” for maintaining the productive part of the economy but squeezed the unproductive speculators and businesses that were existing because of free money. The strategy, however, stalled in the first half of 2023.
Because of irresponsible management and irresponsible customers, a handful of banks became insolvent in spring 2023 as their customers withdrew uninsured deposits in an old-fashioned “run” on the banks. Because of this fiasco and a lack of fiscal and monetary discipline in the political sector and the Fed, the Fed stepped in and saved the uninsured depositors. Should it have done so? It doesn’t matter, because it did. The result was that the shrinking of the Fed balance sheet was significantly curtailed. Now, some Fed officials are saying interest rates need to come down from current levels to avoid causing unemployment and a recession. The Fed and the Washington establishment have no real reason for wanting inflation curtailed. With the federal government being the largest debtor in the country, it’s in the best interest of the political establishment to say that inflation is bad but, at the same time, do nothing to seriously curtail future inflation. Finally, keep in mind two aspects of inflation: (1) the rate of inflation may slow or speed up at the will of the politicians and Fed under current Fed policies, and (2) inflation is a compounding evil. Look again at the chart above. Notice the top line (blue) and how it accelerates away from the bottom line (red). The space difference between the two lines demonstrates inflation and exhibits how inflation compounds.
There is one other point. The analysts calling for a recession over the last 18 months evidently failed to look at the significant increase in M@ between 2020 and 2022. It’s nearly impossible to have a recession with the huge amount of money circulating. We will experience a recession if the money supply continues to contract, or the debtor/speculators miscalculate and cause a major deleveraging in an economic sector.
You need to have common stocks in your portfolio to offset some or all inflation over time. The key issue is what you pay for the companies you choose to put in your portfolio. The excel spreadsheet constructed in the book 19 Rules for Getting Rich and Staying Rich despite Wall Street assists you in understanding the return on investment (ROI) if the company continues to perform in the future as it has in the past. You don’t need to guess the future, just understand the past. Ask yourself the question: has anything changed at the company? Over a 10-year period, the ROI you receive when buying the company at a certain price will materially impact the portfolio’s potential compounding percentage in the future. The dividend as a percentage of the price you pay will have a major impact on the portfolio’s compounding as well.
Finally, without sufficient portfolio liquidity, when extraordinary opportunities present themselves, you will not be able to take advantage of them. Be prepared.
If the Fed cuts interest rates in 2024, it will be signaling a return to the devaluation of the currency. In the short run, the market will cheer. In the long run, the likelihood of a financial crisis and embedded unacceptable inflation will accelerate.